One of the aspects of my job that I really enjoy is explaining the science of Blood Alcohol Concentration and/or reported levels of Drugs of Abuse to normal everyday folks, judges, jurors, prosecutors and even fellow attorneys.
One of the most common questions I get asked is in the area of gas chromatography. Just yesterday a colleague from Texas called me up to help him interpret a Gas Chromatography result. He asked:
How do they make the squiggly lines [of a chromatogram] turn into a magic number [the reported BAC]?
It’s a great question. In essence, how do we take the electrical signal output from the detector and resolve that raw data into reported quantified result for our analyte of interest?
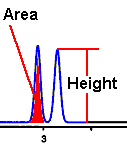
In chromatography and in particular when a Flame Ionization Detector is used as the quantifying device, the method that we use to arrive the ultimate reported result is a product of the peak of the chromatogram. The peak height, the peak shape and the peak area are important.

We take the area under the peak, then apply that numeric to the calibration curve to arrive at the reported result.
The peak shape should be Poisson, Gaussian or close to Gaussian. [[Blogger’s note: in Wednesday’s post we will describe what consequences can occur if it is not]]
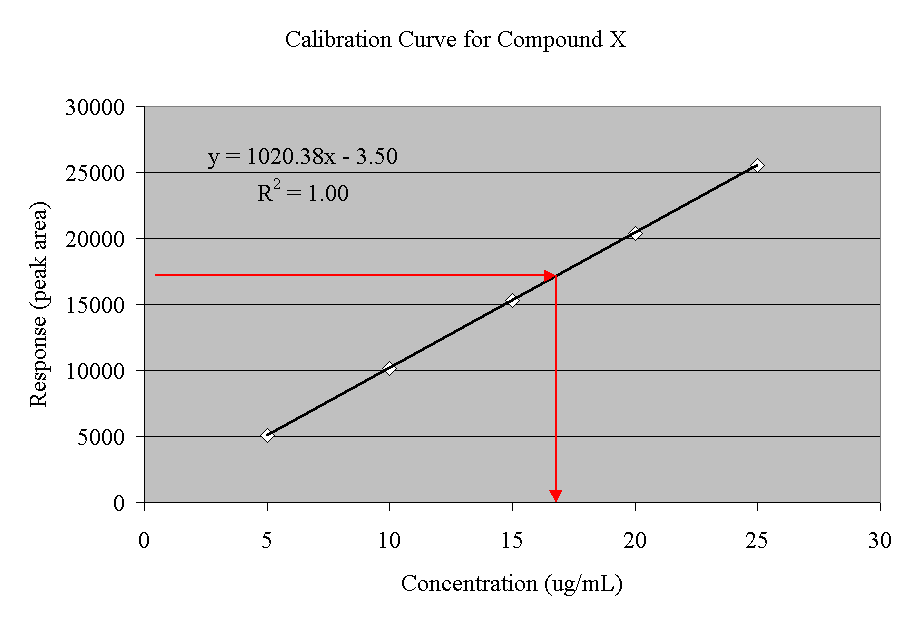
A calibration curve is simply a graph where concentration is plotted along the x-axis and area is plotted along the y-axis. [See the previous post about calibration curves-When is a straight line a curve: Calibration curve]

Figure 2 is an example of a calibration curve for a hypothetical compound X. It was created by running 5 different calibration standards (5, 10, 15, 20, 25 g/mL). Each concentration gave a peak area (5000, 10000, 15000, 20000, 25000). Peak area was then plotted against the concentrations.
Once we have constructed our curve, we can analyze our sample. We simply determine the peak area for the analyte in our sample, and then draw a line on the graph at that area (note the red arrows). When the calibration curve is reached, we drop a line down to the x-axis. That will give us the concentration of the analyte in our sample. This is why the area under the peak and peak shape is important in gas chromatography.
-Justin J. McShane, Esquire, Pennsylvania DUI Attorney
I am the highest rated DUI Attorney in PA as Rated by Avvo.com
You can follow me on Twitter, Facebook or Linkedin

Board Certified Criminal Trial Advocate
By the National Board of Trial Advocacy
A Pennsylvania Supreme Court Approved Agency
One response to “How do they make the squiggly lines turn into a magic number: Area under the peak”